Recently, I wanted to stress-test and benchmark some changes to the Kudu RPC server, and decided to use YCSB as a way to generate reasonable load. While running YCSB, I noticed interesting results, and what started as an unrelated testing exercise eventually yielded some new insights into Kudu’s behavior. These insights will motivate changes to default Kudu settings and code in upcoming versions. This post details the benchmark setup, analysis, and conclusions.
This post is written as a Jupyter notebook, with the scripts necessary to reproduce it on GitHub. As a result, you’ll see snippets of python code throughout the post, which you can safely skip over if you aren’t interested in the details of the experimental infrastructure.
Setup
In order to isolate the Kudu Tablet Server code paths and remove any effects of networking or replication protocols, this benchmarking was done on a single machine, on a table with no replication.
Software versions
- YCSB trunk as of git revision 604c50dbdaba4df318d4e703f2381e2c14d6d62b is used to generate load.
- The Kudu server was running a local build similar to trunk as of 4/20/2016.
- The OS is CentOS 6 with kernel 2.6.32-504.30.3.el6.x86_64
Hardware
- The machine is a 24-core Intel(R) Xeon(R) CPU E5-2680 v3 @ 2.50GHz
- CPU frequency scaling policy set to ‘performance’
- Hyperthreading enabled (48 logical cores)
- 96GB of RAM
- Data is spread across 12x2TB spinning disk drives (Seagate model ST2000NM0033)
- The Kudu Write-Ahead Log (WAL) is written to one of these same drives
Experimental setup
The single-node Kudu cluster was configured, started, and stopped by a Python script run_experiments.py which cycled through several different configurations, completely removing all data in between each iteration. For each Kudu configuration, YCSB was used to load 100M rows of data (each approximately 1KB). YCSB is configured with 16 client threads on the same node. For each configuration, the YCSB log as well as periodic dumps of Tablet Server metrics are captured for later analysis.
Note that in many cases, the 16 client threads were not enough to max out the full performance of the machine. These experiments should not be taken to determine the maximum throughput of Kudu – instead, we are looking at comparing the relative performance of different configuration options.
Benchmarking Synchronous Insert Operations
The first set of experiments runs the YCSB load with the sync_ops=true configuration option. This option means that each client thread will insert one row at a time and synchronously wait for the response before inserting the next row. The lack of batching makes this a good stress test for Kudu’s RPC performance and other fixed per-request costs.
The fact that the requests are synchronous also makes it easy to measure the latency of the write requests. With request batching enabled, latency would be irrelevant.
Note that this is not the configuration that maximizes throughput for a “bulk load” scenario. We typically recommend batching writes in order to improve total insert throughput.
Results with default configuration
Here we load the results of the experiment and plot the throughput and latency over time for Kudu in its default configuration.
%matplotlib inline
%run utils.py
from glob import glob
from IPython.core.display import display, HTML
data = load_experiments(glob("results/sync_ops=true/*"))plot_throughput_latency(data['default'])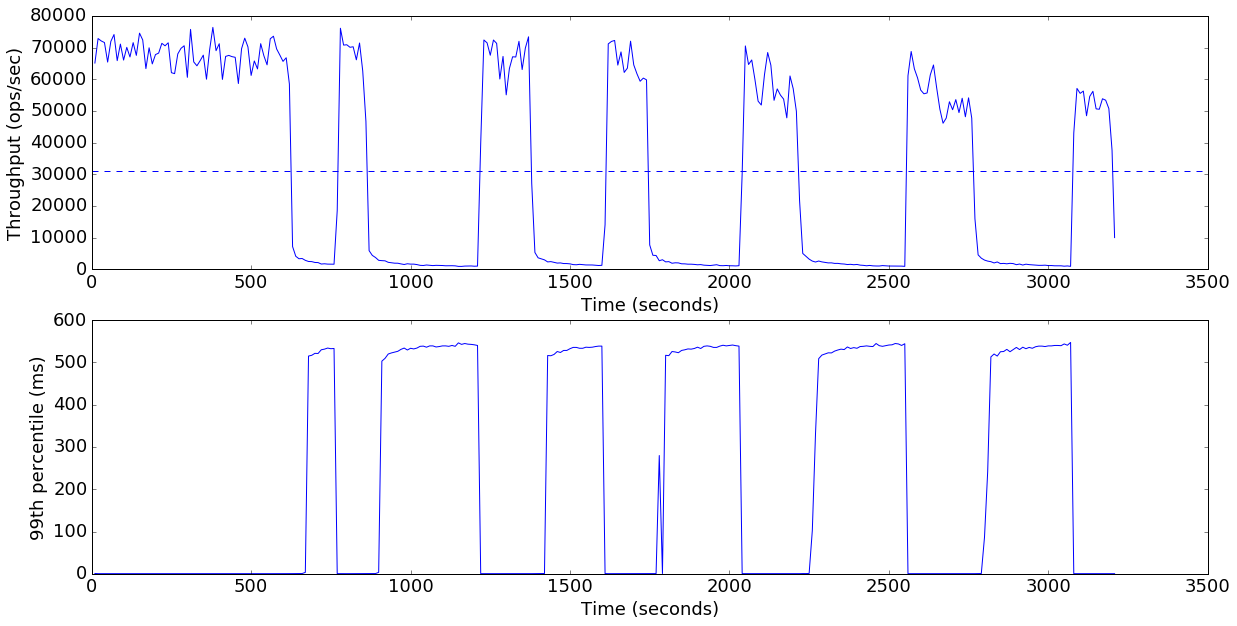
Average throughput: 31163 ops/sec
The results here are interesting: the throughput starts out around 70K rows/second, but then collapses to nearly zero. After staying near zero for a while, it shoots back up to the original performance, and the pattern repeats many times.
Also note that the 99th percentile latency seems to alternate between close to zero and a value near 500ms. This bimodal distribution led me to grep in the Java source for the magic number 500. Sure enough, I found:
public static final int SLEEP_TIME = 500;
Used in this backoff calculation method (slightly paraphrased here):
  long getSleepTimeForRpc(KuduRpc<?> rpc) {
    // TODO backoffs? Sleep in increments of 500 ms, plus some random time up to 50
    return (attemptCount * SLEEP_TIME) + sleepRandomizer.nextInt(50);
  }
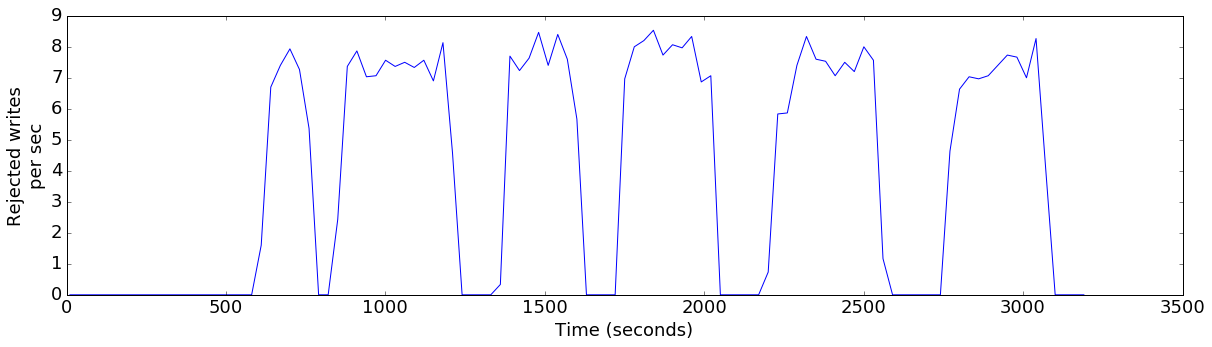
One reason that a client will back off and retry is a SERVER_TOO_BUSY response from the server. This response is used in a number of overload situations. In a write-mostly workload, the most likely situation is that the server is low on memory and thus asking clients to back off while it flushes. Sure enough, when we graph the heap usage over time, as well as the rate of writes rejected due to low-memory, we see that this is the case:
plot_ts_metric(data['default'], "heap_allocated", "Heap usage (GB)", 1024*1024*1024)
plot_ts_metric(data['default'], "mem_rejections", "Rejected writes\nper sec")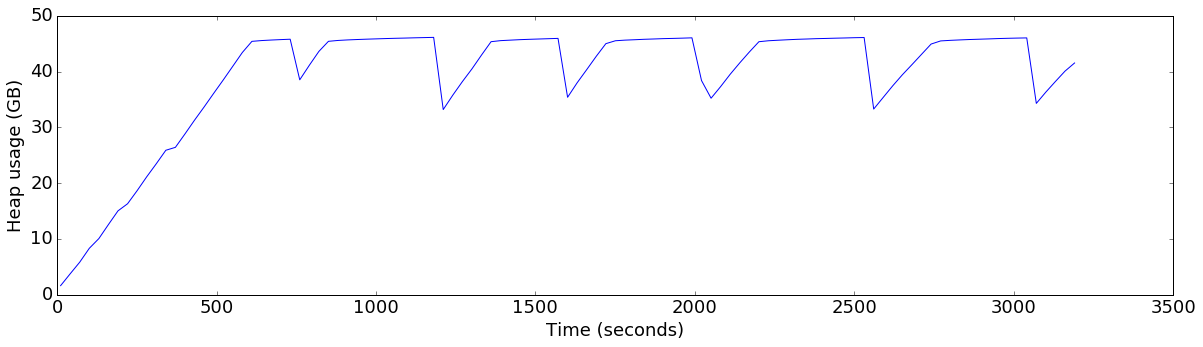
So, it seems that the Kudu server was not keeping up with the write rate of the client. YCSB uses 1KB rows, so 70,000 writes is only 70MB a second. The server being tested has 12 local disk drives, so this seems significantly lower than expected.
Indeed, if we plot the rate of data being flushed to Kudu’s disk storage, we see that the rate is fluctuating between 15 and 30 MB/sec:
plot_ts_metric(data['default'], "bytes_written", "Bytes written\nto disk (MB/s)", 1024*1024)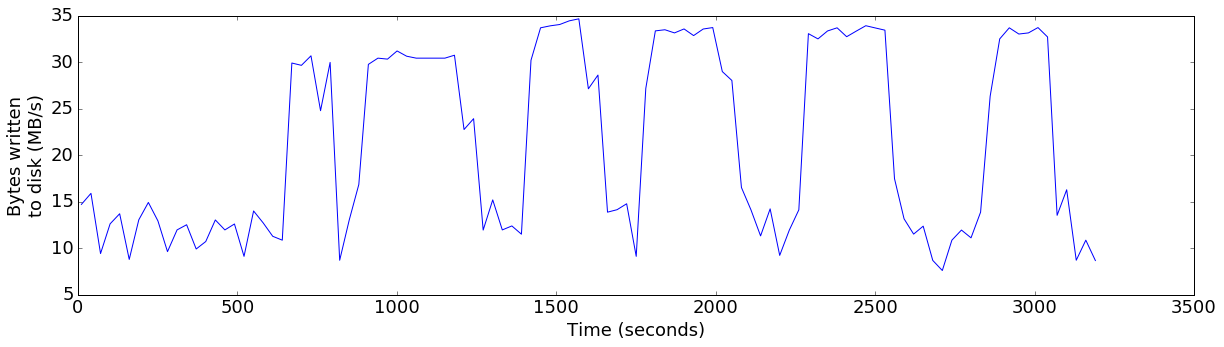
I then re-ran the workload while watching iostat -dxm 1 to see the write rates across all of the disks. I could see that each of the disks was busy in turn, rather than busy in parallel.
This reminded me that the default way in which Kudu flushes data is as follows:
for each column:
  open a new block on disk to write that column, round-robining across disks
iterate over data:
  append data to the already-open blocks
for each column:
  fsync() the block of data
  close the block
Because Kudu uses buffered writes, the actual appending of data to the open blocks does not generate immediate IO. Instead, it only dirties pages in the Linux page cache. The actual IO is performed with the fsync call at the end. Because Kudu defaults to fsyncing each file in turn from a single thread, this was causing the slow performance identified above.
At this point, I consulted with Adar Dembo, who designed much of this code path. He reminded me that we actually have a configuration flag cfile_do_on_finish=flush which changes the code to something resembling the following:
for each column:
  open a new block on disk to write that column, round-robining across disks
iterate over data:
  append data to the already-open blocks
for each column:
  sync_file_range(ASYNC) the block of data
for each column:
  fsync the block
  close the block
The sync_file_range call here asynchronously enqueues the dirty pages to be written back to the disks, and then the following fsync actually waits for the writeback to be complete. I ran the benchmark for a new configuration with this flag enabled, and plotted the results:
plot_throughput_latency(data['finish=flush'])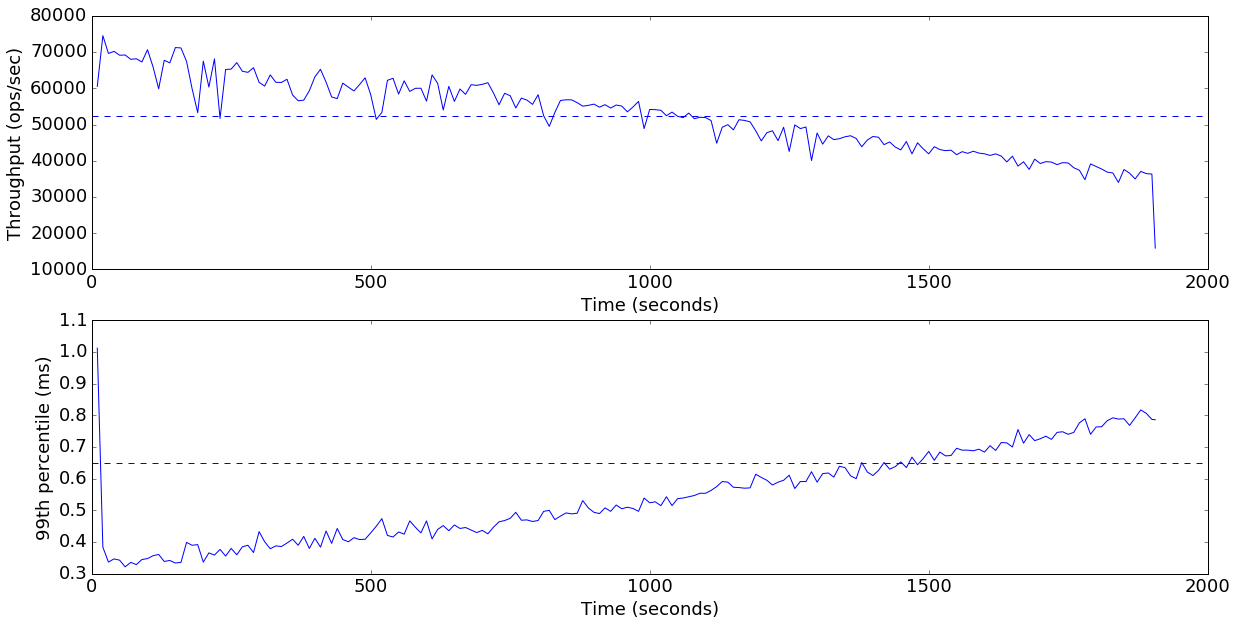
Average throughput: 52457 ops/sec
This is already a substantial improvement from the default settings. The overall throughput has increased from 31K ops/second to 52K ops/second (67%), and we no longer see any dramatic drops in performance or increases in 99th percentile. In fact, the 99th percentile stays comfortably below 1ms for the entire test.
Let’s see how the heap usage and disk write throughput were affected by the configuration change:
plot_ts_metric(data['finish=flush'], "heap_allocated", "Heap usage (GB)", 1024*1024*1024)
plot_ts_metric(data['finish=flush'], "bytes_written", "Bytes written\nto disk (MB/s)", 1024*1024)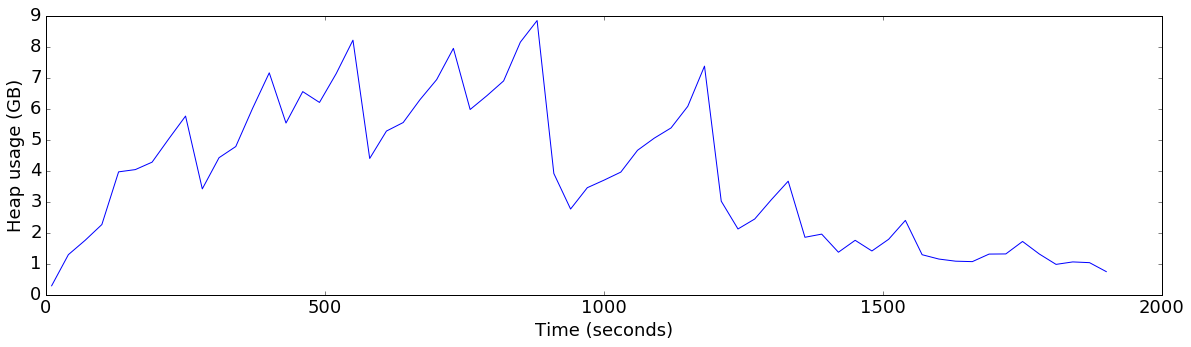
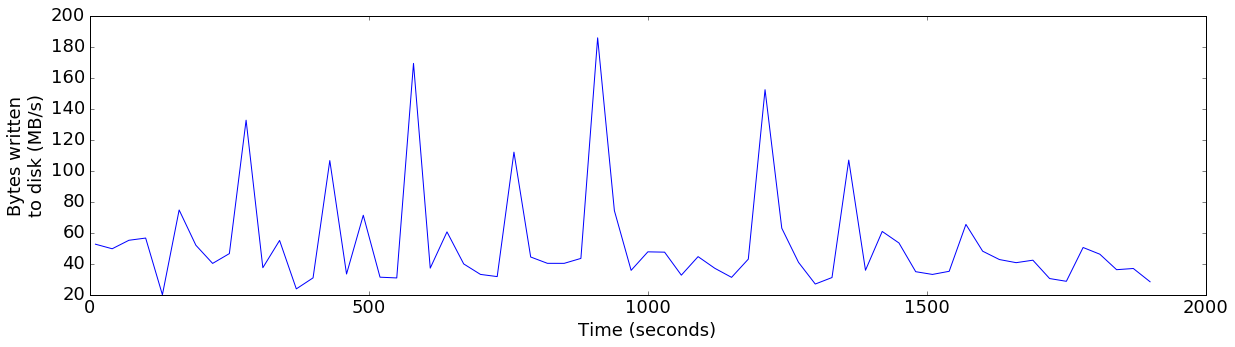
Sure enough, the heap usage now stays comfortably below 9GB, and the write throughput increased substantially, peaking well beyond the throughput of a single drive at several points.
But, we still have one worrisome trend here: as time progressed, the write throughput was dropping and latency was increasing. Additionally, even though the server was allocated 76GB of memory, it didn’t effectively use more than a couple of GB towards the end of the test. Let’s dig into the source of the declining performance by graphing another metric:
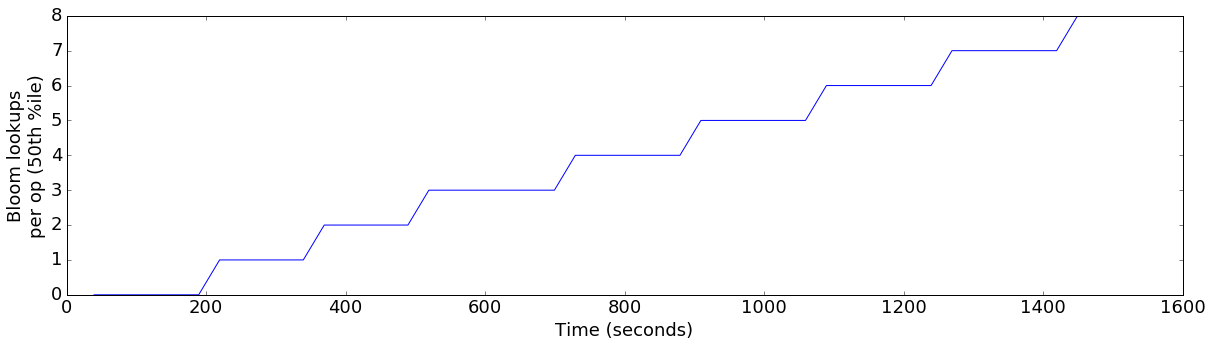
plot_ts_metric(data['finish=flush'], "bloom_lookups_p50", "Bloom lookups\nper op (50th %ile)")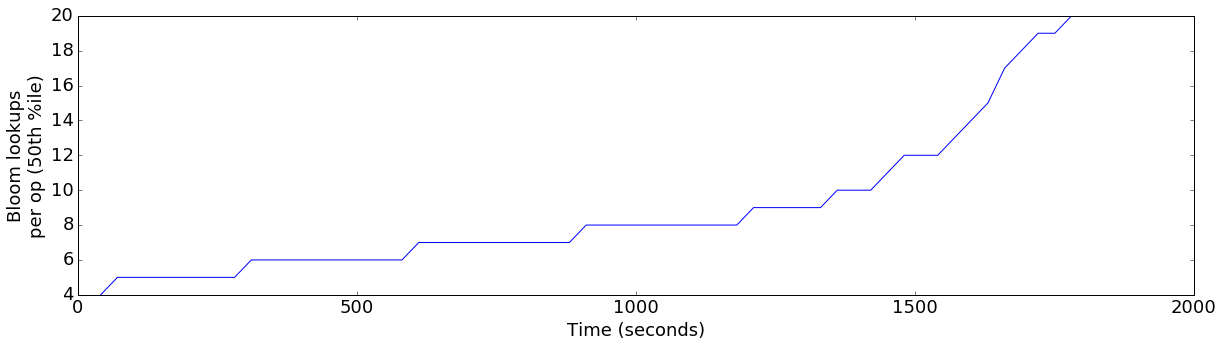
This graph shows the median number of Bloom Filter lookups required for inserted row. We can see that as the test progressed, the number of bloom filter accesses increased. Let’s compare that to the original configuration:
plot_ts_metric(data['default'], "bloom_lookups_p50", "Bloom lookups\nper op (50th %ile)")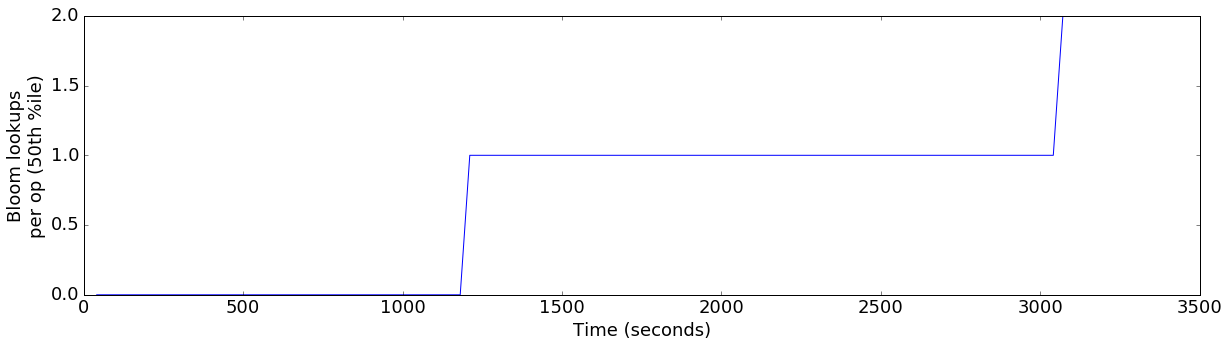
This is substantially different. In the original configuration, we never consulted more than two bloom filters for a write operation, but in the optimized configuration, we’re now consulting a median of 20 per operation. As the number of bloom filter lookups grows, each write consumes more and more CPU resources.
So, why is it that speeding up our ability to flush data caused us to accumulate more bloom filters? The answer is actually fairly simple:
-
In the original configuration, flushing data to disk was very slow. So, as time went on, the inserts overran the flushes and ended up accumulating very large amounts of data in memory. When writes were blocked, Kudu was able to perform these very large (multi-gigabyte) flushes to disk. So, the original configuration only flushed a few times, but each flush was tens of gigabytes.
-
In the new configuration, we can flush nearly as fast as the insert workload can write. So, whenever the in-memory data reaches the configured flush threshold (default 64MB), that data is quickly written to disk. This means that this configuration produces tens of flushes per tablet, each of them very small.
Writing a lot of small flushes compared to a small number of large flushes means that the on-disk data is not as well sorted in the optimized workload. An individual write may need to consult up to 20 bloom filters corresponding to previously flushed pieces of data in order to ensure that it is not an insert with a duplicate primary key.
So, how can we address this issue? It turns out that the flush threshold is actually configurable with the flush_threshold_mb flag. I re-ran the workload yet another time with the flush threshold set to 20GB.
plot_throughput_latency(data['finish=flush+20GB-threshold'])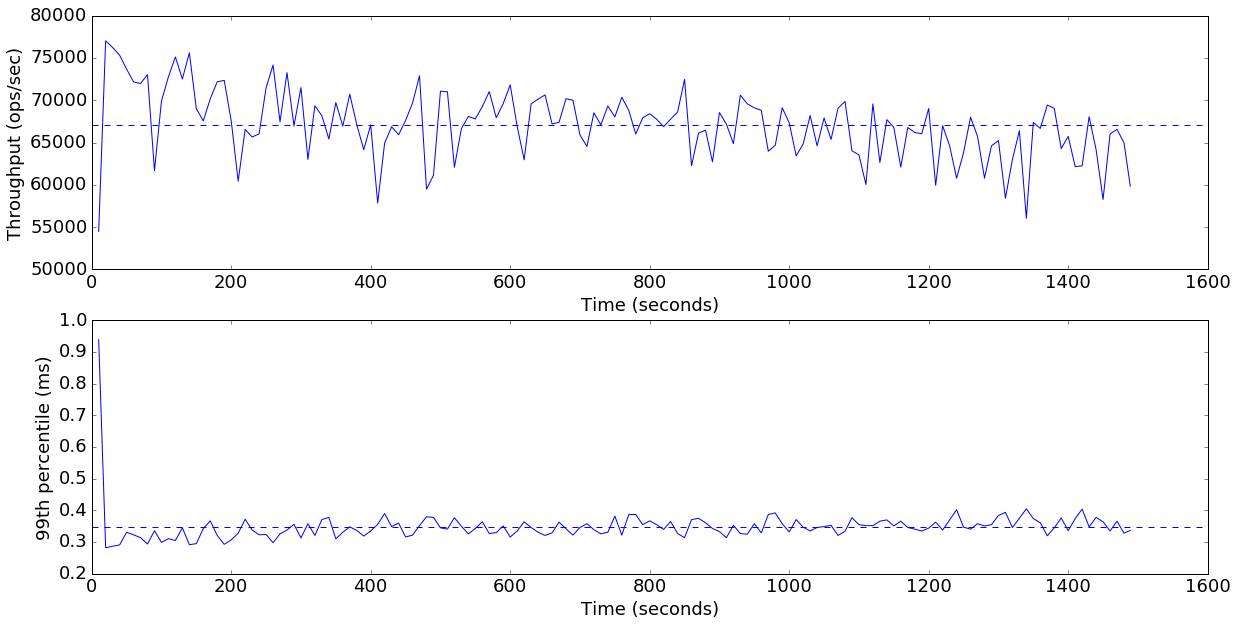
Average throughput: 67123 ops/sec
This gets us another 28% improvement from 52K ops/second up to 67K ops/second (+116% from the default), and we no longer see the troubling downward slope on the throughput graph. Let’s check on the memory and bloom filter metrics again.
plot_ts_metric(data['finish=flush+20GB-threshold'], "heap_allocated", "Heap usage (GB)", 1024*1024*1024)
plot_ts_metric(data['finish=flush+20GB-threshold'], "bloom_lookups_p50", "Bloom lookups\nper op (50th %ile)")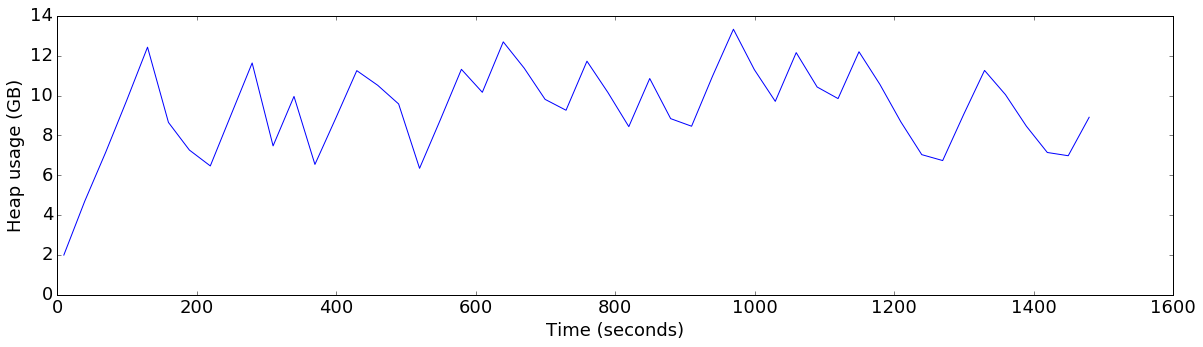
The first thing to note here is that, even though the flush threshold is set to 20GB, the server is actually flushing well before that. This is because there are other factors which can also cause a flush:
- if data has been in memory for more than two minutes without being flushed, Kudu will trigger a flush.
- if the server-wide soft memory limit (60% of the total allocated memory) has been eclipsed, Kudu will trigger flushes regardless of the configured flush threshold.
In this case, the soft limit is around 45GB, so we are seeing the time-based trigger in action.
The other thing to note is that, although the bloom filter lookup count was still increasing, it did so much less rapidly. So, when inserting a much larger amount of data, we would expect that write performance would eventually degrade. However, given time for compactions to catch up, the number of bloom filter lookups would again decrease. The faster flush performance with this configuration would also speed up compactions, resulting in faster recovery back to peak performance.
Conclusions for synchronous workload
It seems that there are two configuration defaults that should be changed for an upcoming version of Kudu:
- we should enable the parallel disk IO during flush to speed up flushes
- we should dramatically increase the default flush threshold from 64MB, or consider removing it entirely.
Additionally, this experiment highlighted that the 500ms backoff time in the Kudu Java client is too aggressive. Although the server had not yet used its full amount of memory allocation, the client slowed to a mere trickle of inserts. Instead, the desired behavior would be a graceful degradation in performance. Making the backoff behavior less aggressive should improve this.
Tests with Batched Writes
The above tests were done with the sync_ops=true YCSB configuration option. However, we expect that for many heavy write situations, the writers would batch many rows together into larger write operations for better throughput.
I wanted to ensure that the recommended configuration changes above also improved performance for this workload. So, I re-ran the same experiments, but with YCSB configured to send batches of 100 insert operations to the tablet server using the Kudu client’s AUTO_FLUSH_BACKGROUND write mode.
This time, I compared four configurations:
- the Kudu default settings
- the defaults, but configured with
cfile_do_on_finish=flushto increase flush IO performance - the above, but with the flush thresholds configured to 1G and 10G
For these experiments, we don’t plot latencies, since write latencies are meaningless with batching enabled.
data = load_experiments(glob("results/sync_ops=false/*"))for config in ['default', 'finish=flush', 'finish=flush+1GB-threshold', 'finish=flush+10GB-threshold']:
display(HTML("<hr><h3>%s</h3>" % config))
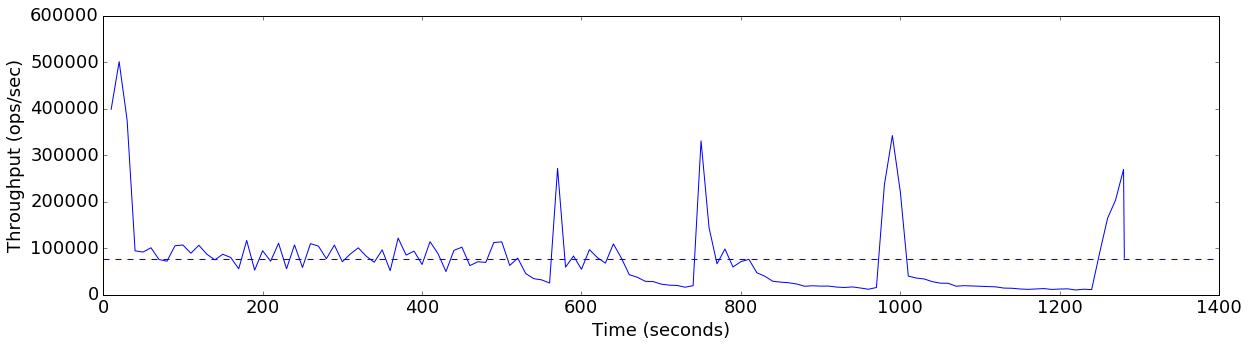
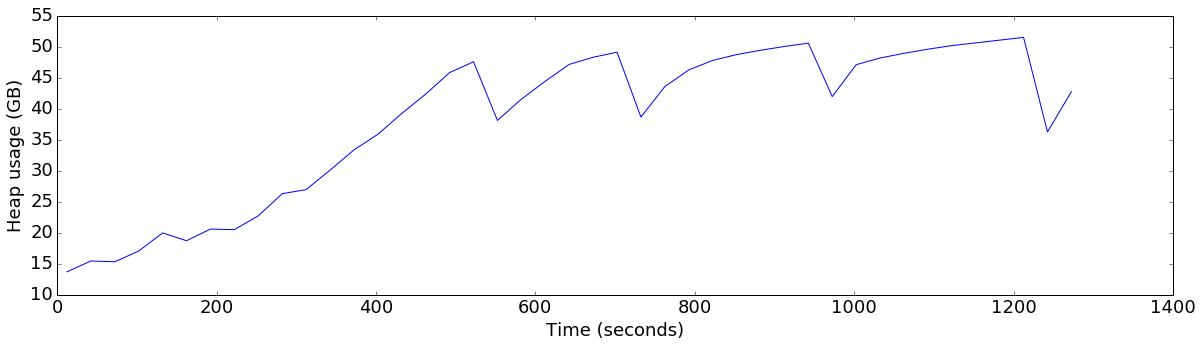
plot_throughput_latency(data[config], graphs=['tput'])
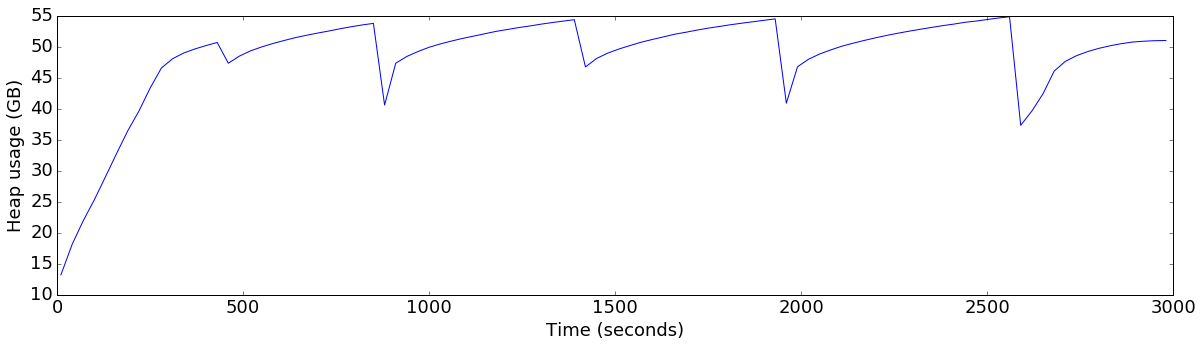
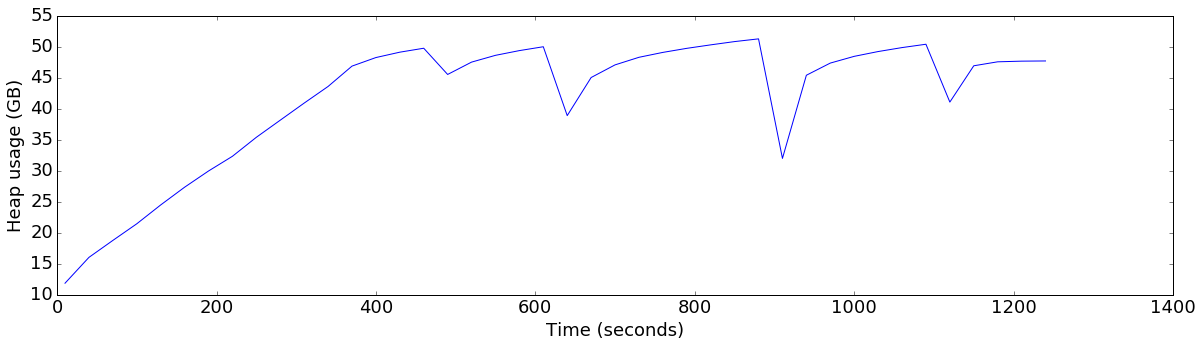
plot_ts_metric(data[config], "heap_allocated", "Heap usage (GB)", divisor=1024*1024*1024)default
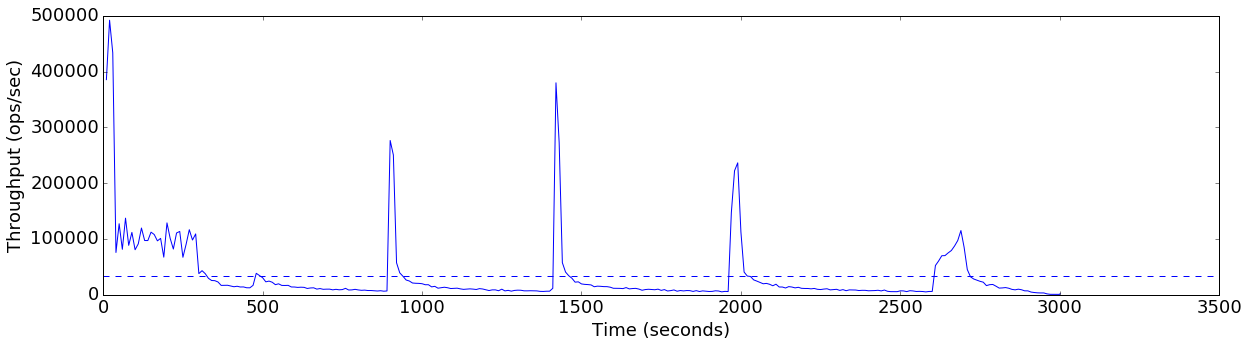
Average throughput: 33319 ops/sec
finish=flush
Average throughput: 80068 ops/sec
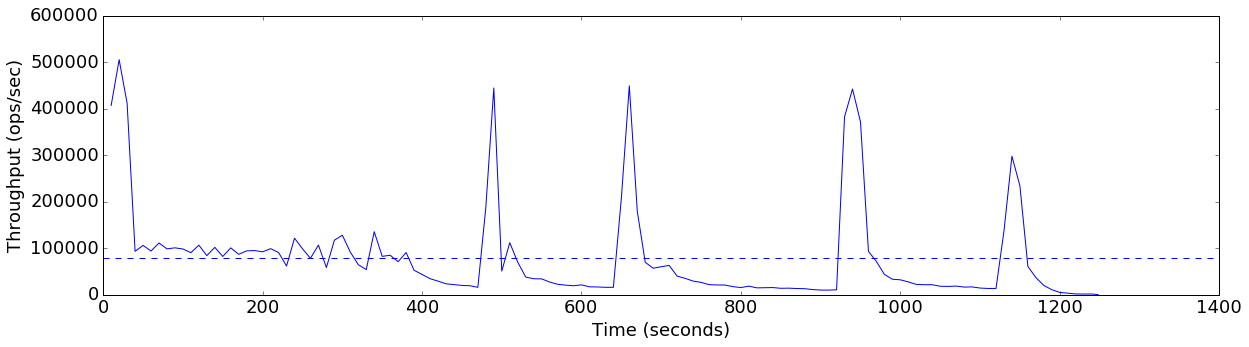
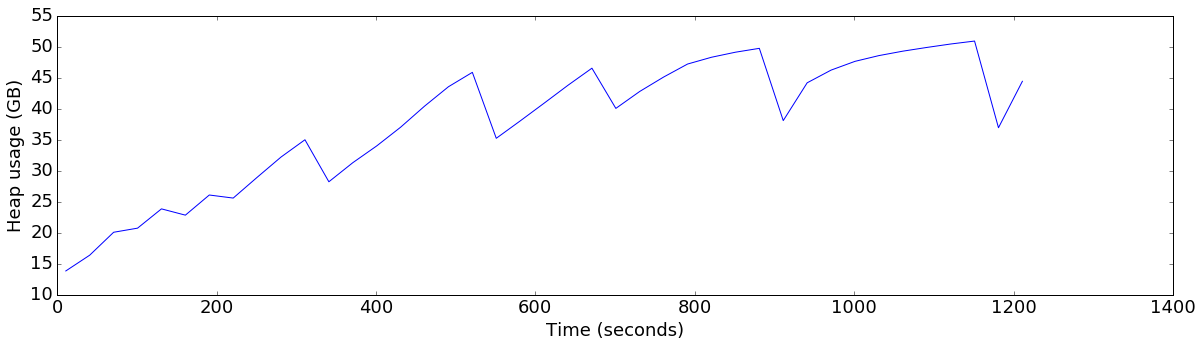
finish=flush+1GB-threshold
Average throughput: 78040 ops/sec
finish=flush+10GB-threshold
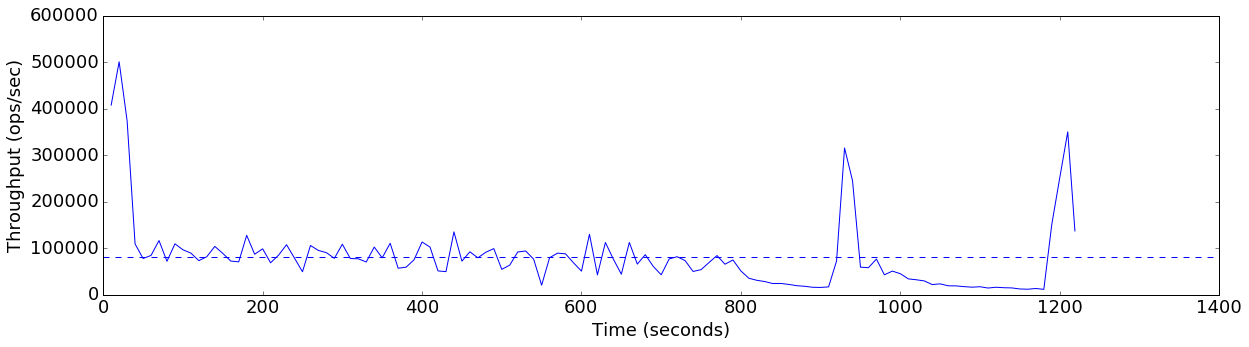
Average throughput: 82005 ops/sec
Conclusions with batching enabled
Indeed, even with batching enabled, the configuration changes make a strong positive impact (+140% throughput).
It is worth noting that, in this configuration, the writers are able to drive more load than the server can flush, and thus the server does eventually fall behind and hit the server-wide memory limits, causing rejections. Larger flush thresholds appear to delay this behavior for some time, but eventually the writers out-run the server’s ability to write to disk, and we see a poor performance profile.
I anticipate that improvements to the Java client’s backoff behavior will make the throughput curve more smooth over time. Additionally, Kudu can be configured to run with more than one background maintenance thread to perform flushes and compactions. Given 12 disks, it is likely that increasing this thread count from the default of 1 would substantially improve performance.
Overall conclusions
07/11/17 Update: As of Kudu 0.10.0, the default configuration was changed based on the results of the above exploration. We recommend against modifying these configuration variables in Kudu 1.0 or later.
From these experiments, it seems clear that changing the defaults would be beneficial for heavy write workloads, regardless of whether the writer is using batching or not. The consistency of performance is increased as well as the overall throughput.
We will likely make these changes in the next Kudu release. In the meantime, users can experiment by adding the following flags to their tablet server configuration:
--cfile_do_on_finish=flush--flush_threshold_mb=10000
Note that, even if the server hosts many tablets or has less memory than the one used in this test, flushes will still be triggered if the overall memory consumption of the process crosses the configured soft limit. So, configuring a 10GB threshold does not increase the risk of out-of-memory errors.
Further investigation
Although the above results show that there is clear benefit to tuning, it also raises some more open questions. In particular:
- Kudu can be configured to use more than one background thread to perform flushes and compactions. Would increasing IO parallelism by increasing the number of background threads have a similar (or better effect)? Or would increasing the background thread count actually have compound benefits and show even better results than seen here?
- In the above experiments, the Kudu WALs were placed on the same disk drive as data. As we increase the throughput of flush operations, does contention on the WAL disk adversely affect throughput?
Keep an eye out for an upcoming post which will explore these questions.